IAU100 exhibition
data visualization and graphics
data visualization and graphics
“Above and Beyond: Making Sense of The Universe for 100 years” is an open-source travelling exhibition celebrating a century of scientific and technological progress. Initiated by the International Astronomical Union (IAU), the global association of professional astronomers active in professional research and education in astronomy, and designed and produced by Science Now, the science and strategic design studio focusing on science and technology communication.
The exhibition premiered at the 30th IAU General Assembly in August 2018 in Vienna and has since been travelling to selected European cities (Bratislava, Brno, Brussels), whereas it’s low-cost, community orientated version, has been developed in various places around the world – ranging from Chile, Egypt and India up to Indonesia.
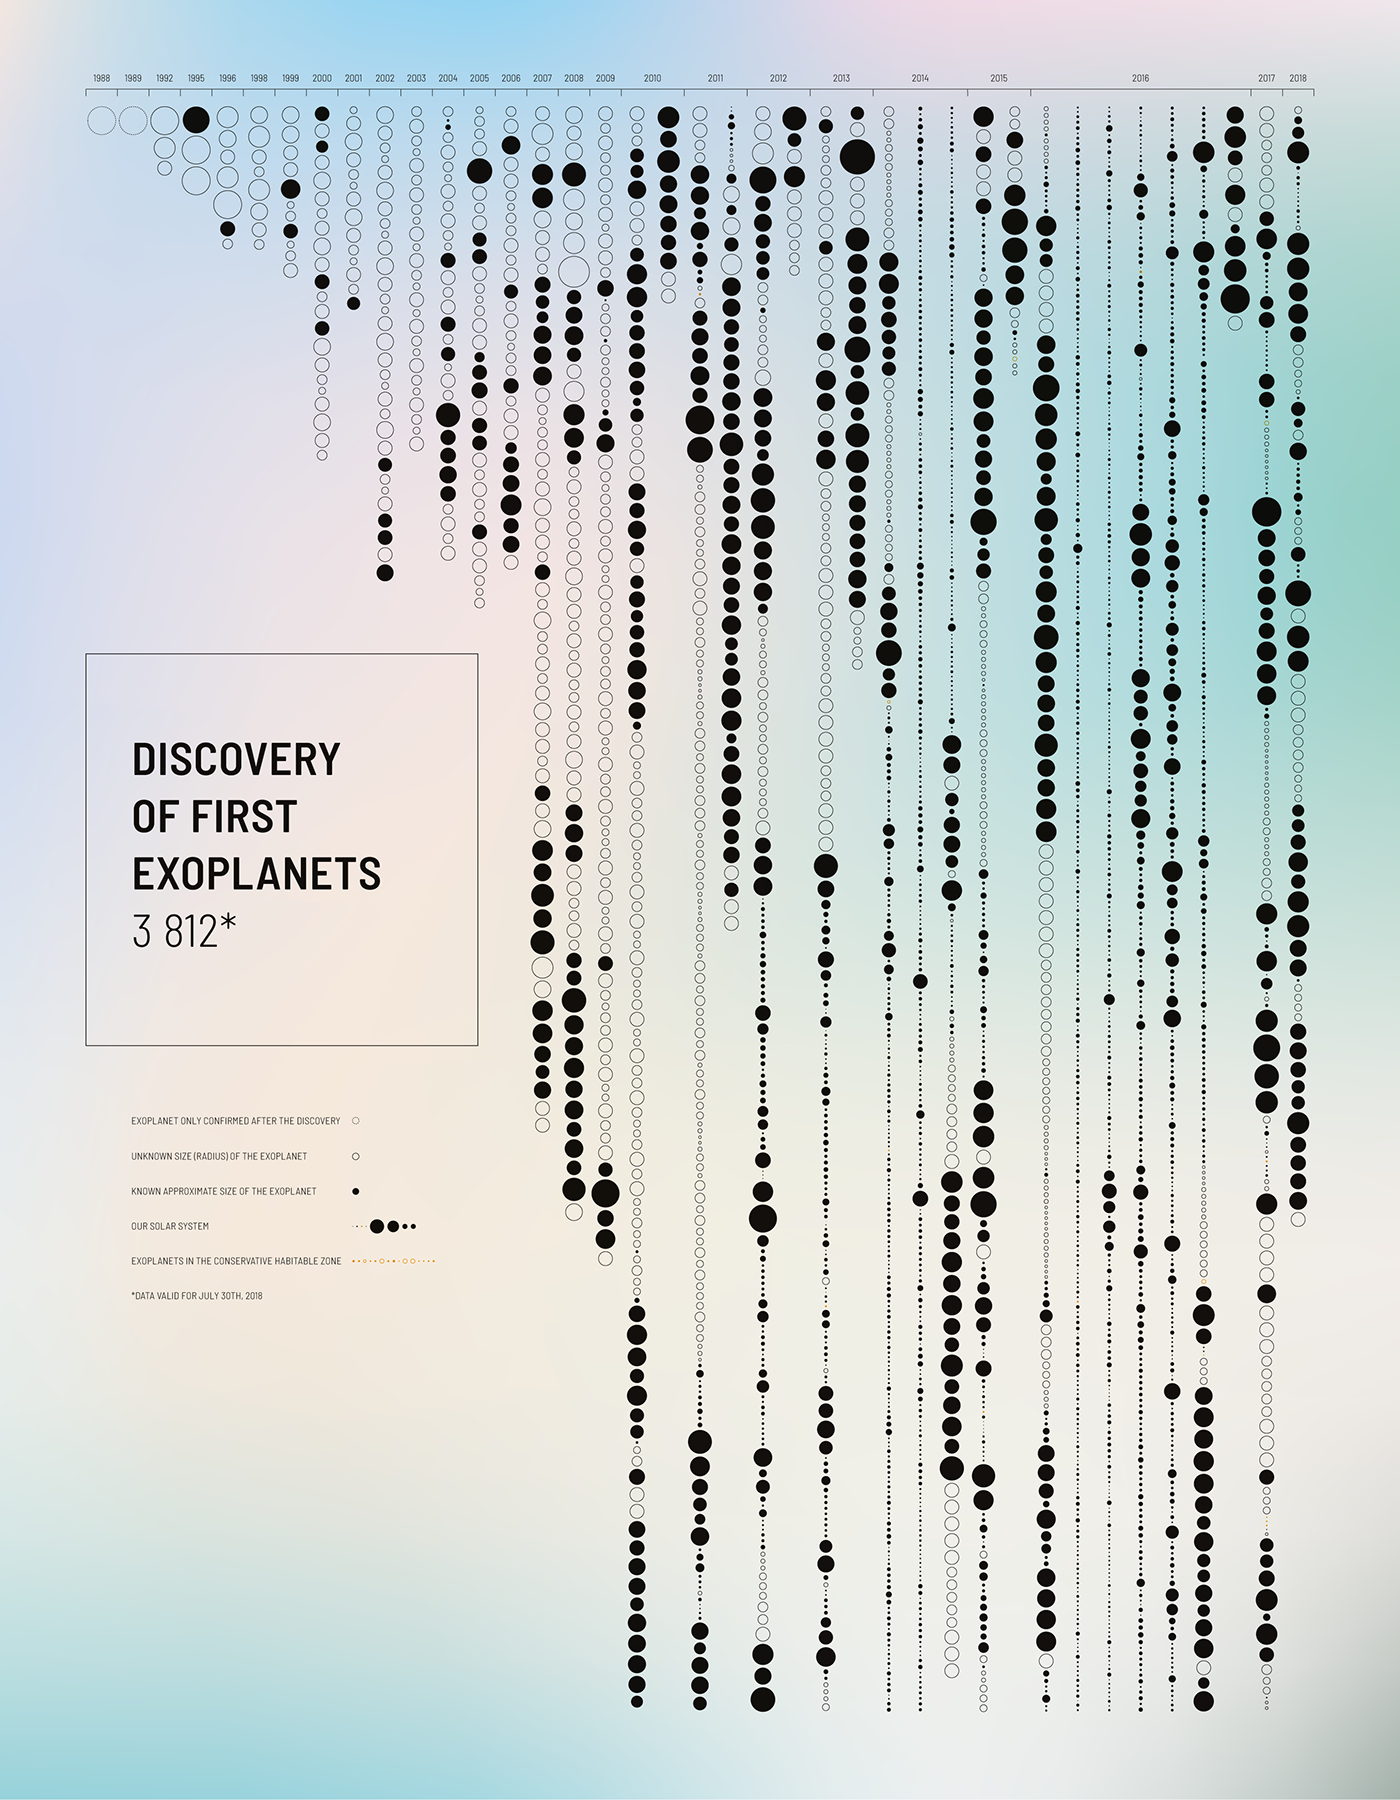
The exhibition included a number of original data visualizations and infographics that were developed for the sole purpose of the exhibition. The approach to data visualization represented a blend of easy-accessible infographics with neon-noire pop style, all this to create a dominating impression of cosmic scale-driven experience. The materials were later released under the Creative Commons license and translated to posters and postcards.
See also:
Credits:
Executive Producers:
Ewine Van Dishoeck (Leiden University, IAU)
Jan Pomierny (Science Now)
Pedro Russo (Leiden University, IAU)
Creative Producer:
Łukasz Alwast (Science Now)
IAU100 Coordinator:
Jorge Rivero Gonzalez (Leiden University, IAU)
Concept and content development:
Łukasz Alwast (Science Now)
Kamil Deresz (Science Now)
Milena Ratajczak (Science Now)
Pedro Russo (Leiden University, IAU)
Jan Pomierny (Science Now)
Creative concept and design:
Lena Mitkowa (leniva° fullmetal agency)
Janek Mońka (leniva° fullmetal agency)
Neon Neonov (leniva° fullmetal agency)
photo "Karl Jansky explaining source of radio emission" – credit: Bell Laboratories / Nokia Corporation